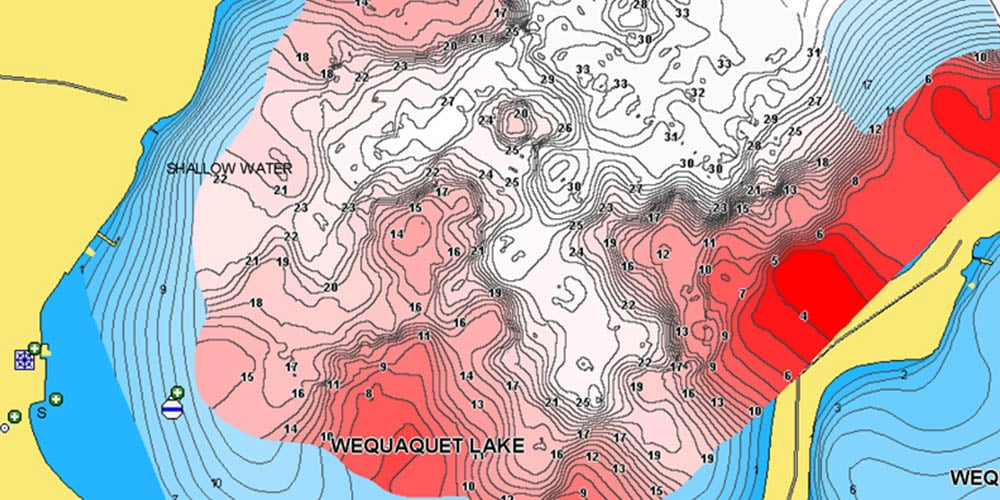
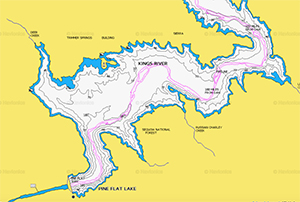
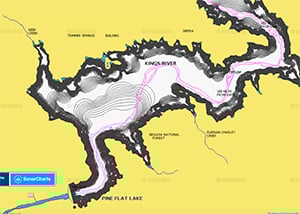
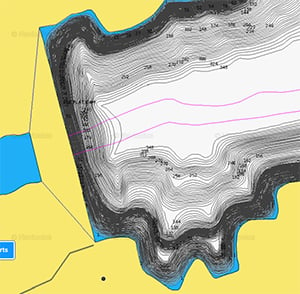
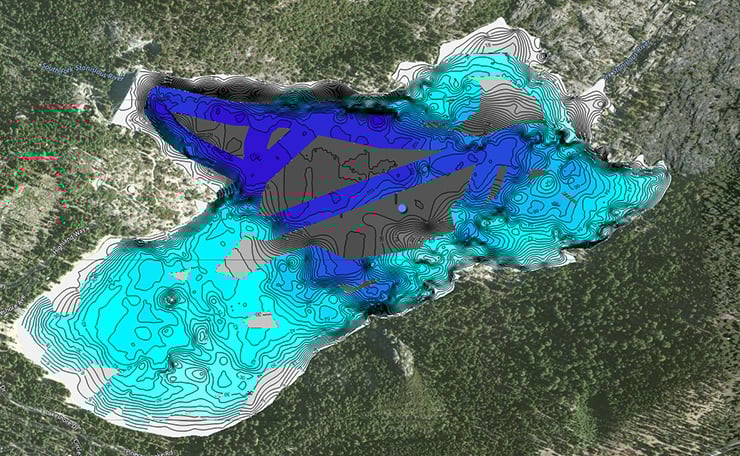
Three views of Pine Flat Lake. Top: the standard Navionics Boating chart. Middle: the crowd-sourced Sonar Charts view. Bottom: a close-up of the dam showing a steep drop-off with 1-foot contours.
The Problem with Existing Charts
You trailer your boat to a new lake, power up the chartplotter, and look at the map. What do you see? Not much detail — and very little that will help you find fish. Soundings that were never taken, or were taken decades ago, leave large areas of many inland lakes effectively unmapped for angling purposes.
The second problem is more dangerous: you are motoring near your home port, the chart shows plenty of water under the keel, and then the shallow water alarm fires. Where did that mud bank come from? Coastal waters shift constantly — sand bars, shoals, and silted channels change between seasons, and the chart may not reflect any of it.
High-contrast electronic charts look authoritative, but they are only as good as their underlying data — soundings that in many cases were taken in the 19th century. Many inland lakes and shallow coastal areas have been charted poorly or not at all. Happily, there is an elegant solution. You can now make your own sonar charts, and the software to do it comes free with most modern chartplotters.
- How Custom Sonar Mapping Works
- Garmin Quickdraw Contours
- Navionics Sonar Charts
- Tips for Better Results
- FAQs
How Custom Sonar Mapping Works
The process is the same regardless of which system you use. As your boat moves across the water with sonar running, the chartplotter records the depth at each GPS position. Software converts these thousands of depth/position data points into a bathymetric map with detailed depth contours — typically with one-foot resolution. The resulting map shows bottom structure, depth changes, vegetation, and bottom hardness at a level of detail that published charts rarely achieve for inland lakes or secondary waterways.
There are two distinct approaches: private mapping, where only your own sonar data contributes to your chart, and crowd-sourced mapping, where sonar data uploaded by other boaters adds to a shared community chart. Both approaches produce dramatically better detail than standard published charts for the specific waters you frequent.
Garmin Quickdraw Contours
Garmin Quickdraw Contours is a free software feature built into compatible Garmin sonar-enabled chartplotters. No upload or cloud processing is required — the map is created in real time on the chartplotter itself, with 1-foot contours, as the boat moves. You fish as normal, and the chart builds itself.
Quickdraw Contours is compatible with Garmin HD-ID, CHIRP-enabled, Panoptix, DownVü, ClearVü, and NMEA 2000-compatible depth transducers. It is built into current Garmin echoMAP and GPSMAP series chartplotters. Check Garmin’s current compatibility list at their support site for the specific units supported by your version of the software, as it has expanded significantly since the feature was introduced.
Key advantages of Quickdraw Contours:
- Fully private by default: Garmin does not require you to upload your sonar data to get your map back. You own the maps you create. Sharing with the Quickdraw Community is optional.
- Real-time results: The map appears on screen as you move — no waiting for processing or uploading.
- Custom POIs: You can mark and label navigation aids, timber, brush piles, favorite fishing spots, submerged structure, docks, and ramps directly on your map.
- Community sharing (optional): Maps can be kept private or shared with others at no cost. The Quickdraw Community allows you to download maps created by other Garmin users for waters you haven’t mapped yourself.
- Free: No subscription required. The feature is included in compatible Garmin chartplotter software.
Navionics Sonar Charts
Navionics (now a Garmin brand) offers crowd-sourced Sonar Charts as part of its Navionics+ and Platinum+ chart subscriptions. The key difference from Quickdraw is the crowd-sourcing model: Navionics Sonar Charts incorporate sonar data uploaded by other participating boaters across the community, not just your own passes over a body of water. This means that popular lakes and coastal areas may already have substantial community-contributed detail before you ever run your own sonar there.
Pinecrest Lake in California has been partially charted with Navionics Sonar Charts. Dark gray areas have not yet been mapped by community sonar data.
The Navionics Sonar Charts workflow:
- Record: Enable sonar logging on a compatible chartplotter (Lowrance, Simrad, B&G, Raymarine, and others) or via the Navionics Boating app on a connected mobile device. The chartplotter records depth and GPS position data as you travel.
- Upload: Transfer the sonar log to the Navionics Boating app or web portal. You choose whether to keep your data private or contribute it to the Navionics community Sonar Charts for others to benefit from. Community-contributed data is reviewed before being incorporated into the shared chart.
- Download and use: Updated charts incorporating your data (and other users’ data for the same area) are available for download to your chartplotter or the Navionics Boating app. The result is a continuously improving chart of the waters you fish and cruise.
SonarChart Live is Navionics’ real-time version of the feature. When a compatible chartplotter is connected to the Navionics Boating app via Wi-Fi, sonar data streams in real time to the app, creating a live HD bathymetric chart overlay as the boat moves — similar to how Quickdraw Contours works on a Garmin display. Check the current Navionics compatibility list for supported chartplotter models, as this varies by manufacturer and firmware version.
Note on compatibility: Navionics+ and Navionics Platinum+ cards are not compatible with Garmin chartplotters operating Garmin’s own chart software. Garmin users should use Garmin Navionics+ or Garmin Navionics Vision+ products designed specifically for Garmin devices, or use Quickdraw Contours for private mapping. Check Navionics.com for the current chart card and app subscription options for your specific chartplotter brand.
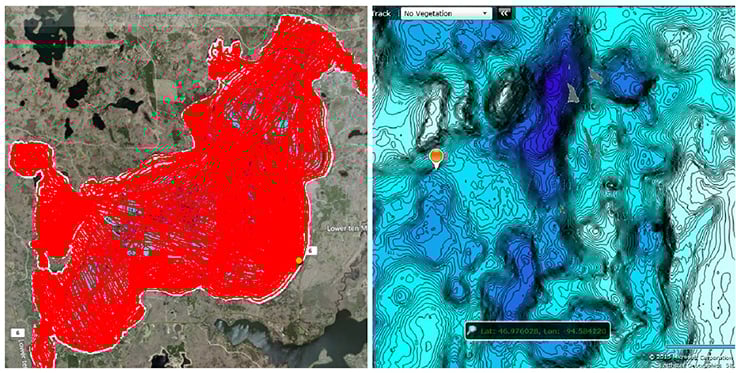
A couple of dedicated anglers created extensive sonar logs of Ten Mile Lake in Canada, uploading 224 trips over two summers to create a map with extraordinary detail. Red lines show their recorded tracks.
Tips for Better Results
- Overlap your passes. The more passes you make, the more complete and accurate the contour map becomes. Single-pass coverage leaves gaps between tracks. Systematic back-and-forth coverage at consistent spacing gives the best results.
- Slow down for accuracy. A green recording circle on a Garmin Quickdraw display indicates good depth and GPS position at speeds under 10 mph. Above 20 mph, data quality drops. Slower, more deliberate passes produce better contour accuracy than high-speed coverage.
- Cover structure edges carefully. The most valuable mapping data is along the edges of structure — the drop-off from a flat into deep water, the outside edge of a weed bed, the lip of a submerged point. Multiple slow passes along these transitions give the clearest picture of where fish will hold.
- Use a quality transducer. For the best and most detailed Quickdraw results, Garmin recommends pairing your chartplotter with a Panoptix PS30 Down transducer. The principle applies across systems: a better transducer provides cleaner depth data that produces more accurate contours.
- Mark points of interest as you go. When your sonar reveals an interesting piece of structure — a submerged timber pile, a rock pinnacle, a sharp depth change — mark it immediately while you are over it. A waypoint placed while you’re directly above the feature is far more accurate than one placed from memory afterward.
Frequently Asked Questions
Do I need to pay for custom sonar mapping software?
Garmin Quickdraw Contours is free and built into compatible Garmin chartplotters with no subscription required. Navionics Sonar Charts are included with Navionics+ and Platinum+ chart subscriptions, which do have an annual cost. SonarChart Live (the real-time Navionics version) requires a compatible chart subscription and a Wi-Fi connection between your chartplotter and the Navionics Boating app on a mobile device.
What is the difference between private and crowd-sourced sonar maps?
Private maps (like those from Garmin Quickdraw Contours by default) include only your own sonar data and are not shared unless you choose to. Crowd-sourced maps (like Navionics Sonar Charts) incorporate sonar data uploaded by many boaters for the same body of water, potentially giving you detailed coverage of areas you have never personally mapped. The tradeoff is that crowd-sourced maps require uploading your data and depending on your area may have limited community coverage if few other boaters have mapped the same water.
Can I use Navionics Sonar Charts on a Garmin chartplotter?
Standard Navionics+ and Platinum+ chart cards are not compatible with Garmin chartplotters. Garmin offers its own Garmin Navionics+ and Garmin Navionics Vision+ products for use on Garmin devices, which include Sonar Charts and other Navionics features optimized for the Garmin platform. Check the current Navionics and Garmin product pages for compatible chart card options for your specific chartplotter.
How fast can I travel while mapping?
For Garmin Quickdraw Contours, best results are achieved at speeds under 10 mph. Data quality is acceptable between 10 and 20 mph but declines at higher speeds. Above 20 mph, GPS and depth data quality is insufficient for accurate contour mapping. Similar principles apply to Navionics SonarChart recording. Slower, more deliberate coverage produces significantly better chart detail than high-speed passes.
What transducers work with these mapping systems?
Garmin Quickdraw Contours works with any Garmin HD-ID, CHIRP-enabled, Panoptix, DownVü, ClearVü, or NMEA 2000-compatible depth transducer. Navionics Sonar Charts work with the sonar recording capability built into compatible Lowrance, Simrad, B&G, Raymarine, and other chartplotters. Check the current compatibility documentation for your specific chartplotter and transducer combination before beginning a mapping project.