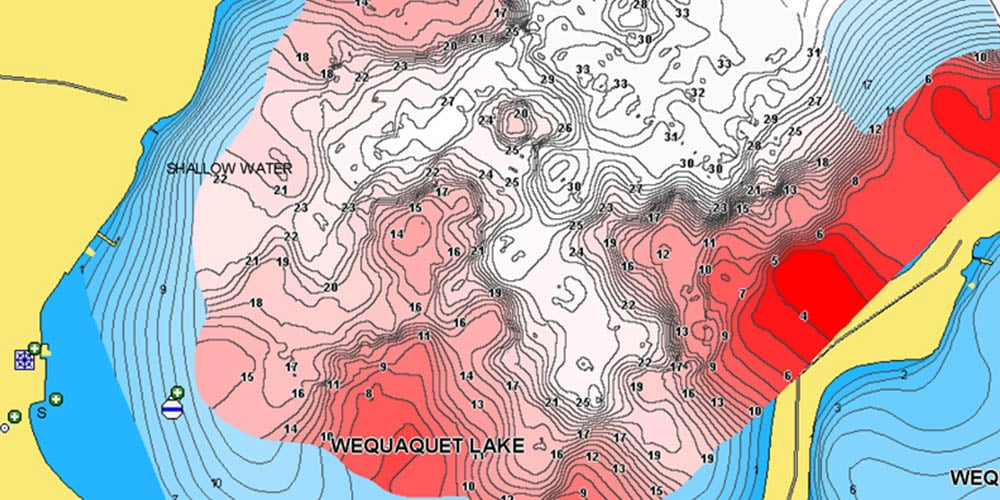
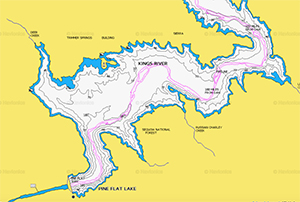
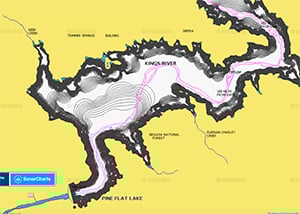
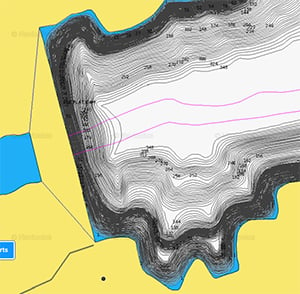
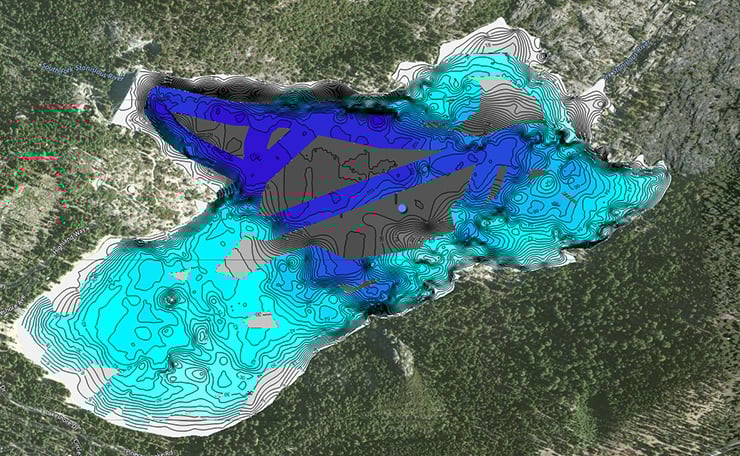
Three views of Pine Flat Lake. The top map is the standard Navionics Boating chart from their web app. The second chart shows their crowd-sourced Sonar Charts view. The third screen is a close-up of the dam (lower left in the other views) showing the steep drop-off with 1’ contours.
Frustrating Situation #1
You trailer your boat to a new lake, power up the chartplotter/sonar combo and look at the map that’s displayed on your crisp color screen. What do you see? Not much detail and very little that’ll help you find the fish. How disappointing it is to find out that nobody has taken any decent soundings.
Frustrating (and Dangerous) Situation #2
You are motoring near your homeport, and the chart shows you’ve got plenty of water under the keel because you’re right on the edge of the channel. Reality intervenes, in the form of the shallow water alarm, so you stop quickly and get the heck out of there. Where did that mud bank come from?
Most of us have experienced situations like these, where our underwater charts either don’t have the detail we need, or they are out-of-date and inaccurate. If you’re an angler, you know that most of the maps out there were created with the emphasis on navigation, not fishing. If you own a sailboat or large powerboat, you may have already experienced running aground, or there is a fair chance you might in the future.
High-contrast and graphically exciting electronic charts look impressive and have the aura of authority, but are only as good as the data—soundings that might have been taken in 1893. Many waters where we use our boats have been charted poorly, or not charted at all.
Happily, there is an elegant solution to potentially dangerous problems of this sort. You can now make your own sonar charts. It’s easy, nearly automatic and you don’t need to know anything about making a map. Just run your boat around with your sonar operating, and clever new software from Garmin, Navionics and Navico does all the work for you. You get high-definition underwater detail with one-foot contours, vegetation and bottom hardness.
Private Maps From Garmin
Manufacturers are using two distinct approaches to creating homemade sonar charts. Garmin has taken a simple approach with their free Quickdraw Contours software. It creates maps for your own (or private) use but gives you the option of sharing them with other users of compatible Garmin sonars.
All you do is fish while it creates maps. The software creates your own submarine topographical maps on screen with one-foot contours, and you can tailor the maps as needed. You can mark and label navaids, timber, brush piles, favorite fishing spots, submerged features, docks, ramps and any point of interest you want to remember on your map.
Quickdraw Contours can be used with any Garmin Panoptix transducer, any HD-ID sonar, any CHIRP-enabled, Garmin ClearVü transducer or NMEA 2000-compatible depth transducer. The software is included on the echoMAP™ CHIRP combo series. It’s also available as a free software download for echoMAP series, GPSMAP® 7400/7600 chartplotter series and GPSMAP 8000/5x7/7x1/8x0/10x0 series.
Crowd-sourced Maps From Navionics, Lowrance, Simrad and B&G
Pinecrest Lake in California has been partially charted with Navionics Sonar Charts. Dark gray areas need to be explored further.
Electronic chart vendor Navionics and hardware maker Navico (parent company for Lowrance, B&G and Simrad) have jumped on board with maps that are crowd-sourced from other users in the boating community.
Their process is a bit more complicated, but the resulting maps include sonar data from other participating boaters, not just coverage from your own sonar scans. To use the Navico Insight Genesis site, you complete three steps:
- 1. Record your sonar log to an SD card on your Lowrance, Simrad or B&G chartplotter.
- 2. Upload the SD card to a computer with Internet access, or upload directly from a mobile device that’s connected to a Wi-Fi enabled chartplotter, and upload the sonar log to the Genesis Cloud. This will automatically create a custom map from your data. During the upload process, you have the option to share your sonar logs for the benefit of the Insight Genesis community or to keep them private. Data not marked as private at the time of upload will be included in the Social Map after five business days. This allows the Insight Genesis Quality Control team enough time to ensure that the social map only includes trips that meet Navico’s quality standards.
- 3. Use: Insert the SD card in your chartplotter and download your map. Then begin using the custom map to see depths, structure, vegetation and other details.
Navionics Sonar Charts works about the same way as Insight Genesis. You record your sonar log, upload to the Navionics cloud app, then insert your SD card back into the chartplotter and begin using your map, updated with your new data plus other boaters’ soundings of the same location.
Navionics also has a paid subscription program (for $99 per year) called Freshest Data. Owners of a Navionics Platinum+ chart can have the most up-to-date chart every time you go boating. Navionics adds 2,000 updates to their charts daily by integrating Notices to Mariners, new publications, Navionics’ own surveys and reports, research and reports from users. Updates include: coastline and contour improvements; buoy changes and sand bar shifts; newly marked rocks and submerged structures; new points of interest and much more. It includes the above updates plus crowd-sourced Sonar Charts and Community edits.
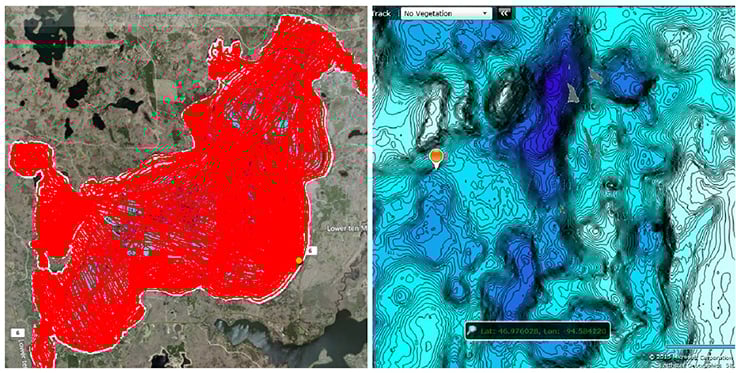
A couple of anglers went crazy creating Insight Genesis sonar logs of Ten Mile Lake in Canada. They uploaded 224 trips over two summers to create a map with mind-boggling detail! Red lines at left are their tracks.
Sonar Charts are included on compatible plotters with Navionics+, Navionics Updates (for Gold and HotMaps Premium), Platinum+ and HotMaps Platinum. Note that Sonar Charts are not compatible with Garmin chartplotters operating with software version 2015.0202 or newer.
Navionics also offers a Sonar Charts Live feature that allows you to create private custom maps in real time (much like the Garmin Quickdraw Contours function discussed above). The difference is that you need a mobile device connected via Wi-Fi to a compatible chartplotter. It works with the Dragonfly 4 and 5 PRO and Wi-Fish by Raymarine, SonarPhone T-BOX by Vexilar (SP200 and SP300), and HDS Gen3 by Lowrance. You can also use a Wi-Fi router, like the GoFree WIFI-1 Module made by Navico, or the Sonar Server manufactured by Digital Yacht, to connect a compatible chartplotter/sonar with your mobile device.
That’s a brief look at how you can make your own custom maps. It’s easy and once you have a compatible chartplotter creating your own maps is free.